Vibro-acoustic method as a fast diagnostic tool on load tap changers
By EPR Magazine Editorial June 4, 2024 5:29 pm IST


By EPR Magazine Editorial June 4, 2024 5:29 pm IST

Advanced technologies enable precise evaluation of On-Load Tap-Changer (OLTC) health, ensuring grid stability and longevity through comprehensive assessment and analysis.
By combining dynamic resistance measurement (DRM) and vibro-acoustic measurement (VAM), this method offers a comprehensive analysis of On-Load Tap-Changer (OLTC) health. VAM captures vibration patterns during operation, while DRM focuses on electrical characteristics. Comparing these measurements with reference data allows for an accurate assessment of OLTC conditions. A case study comparing VAM results from sister units demonstrates efficacy of this approach. Overall, this method provides a sophisticated solution for enhancing equipment reliability and lifespan.
OLTC is crucial for maintaining a stable voltage level in the electrical grid. With the help of OLTC, the transformer turns ratio can be adjusted under load to account for voltage fluctuations. This mechanical switching process causes heating and arcing inside OLTC. Consequently, various components will experience wear and tear over their lifetime. Increasingly advanced diagnostic tools have been developed that can reliably analyse and assess the condition of OLTC.
The following example discusses a condition assessment based on combining DRM and VAM. While DRM concentrates on electrical characteristics when the load current is switched, VAM focuses on vibration pattern OLTC produces during switching operation. The evaluation of VAM results relies on comparing them with reference data such as a fingerprint or sister units.
Measurement Setup
The mechanical movements and arcing during an OLTC switching operation produce a wide frequency range of vibrations. VAM allows these vibration patterns to be analysed and compared with reference data and enables the mechanical condition of the tap-changer to be assessed. The signals are sampled at 250 kHz by the measurement system using integrated electronic piezo-electric (IEPE) acceleration sensors. This way, a non-invasive measurement can be performed on the transformer. This can even be done with the transformer in operation throughout the entire process.
VAM Data Evaluation
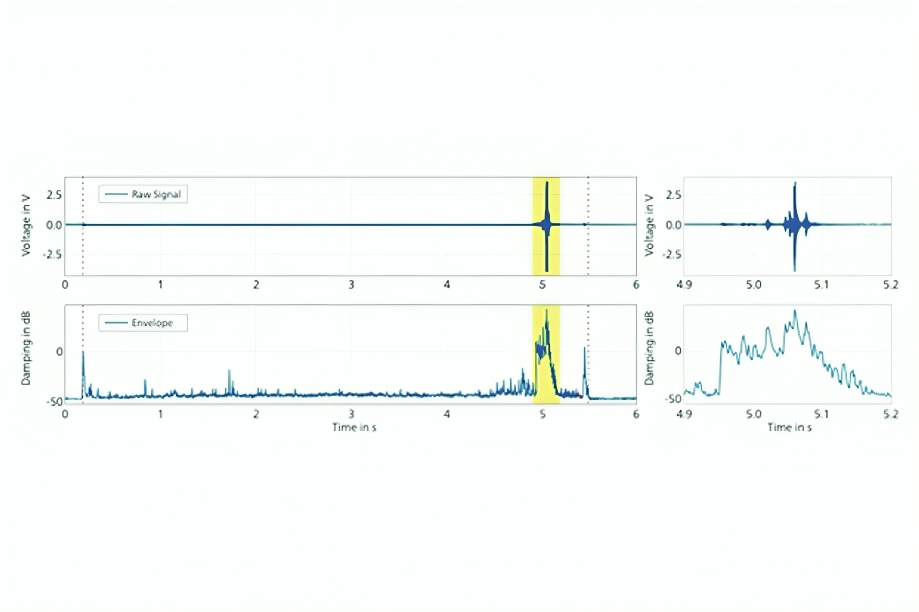
The signal recording covers the entire tap switch operation from motor start to finish [2]. The strongest signal is obtained during the diverter switch operation. As a first post-processing step, a wavelet transformation is applied to the sensor signal. The so-called envelope curve is derived through integration in a typical frequency range from 10 kHz to 100 kHz and subsequent Gaussian filtering. The resulting curve reflects the energy of the raw signal in the defined frequency range. It can be used to compare reference data such as factory fingerprints or data from sister units [4]. Figure 4 illustrates a sensor’s raw signal and the corresponding envelope curve in dB over time.
Figure 4 shows a detailed view of the diverter switch operation (highlighted). Attention should be paid to shifting peaks and less so to amplitude changes between the reference and the actual envelope curve to identify possible mechanical changes in OLTC. The switching time analysis based on the envelope curve shows a considerably higher tolerance for external influences, making it much more suitable for comparisons.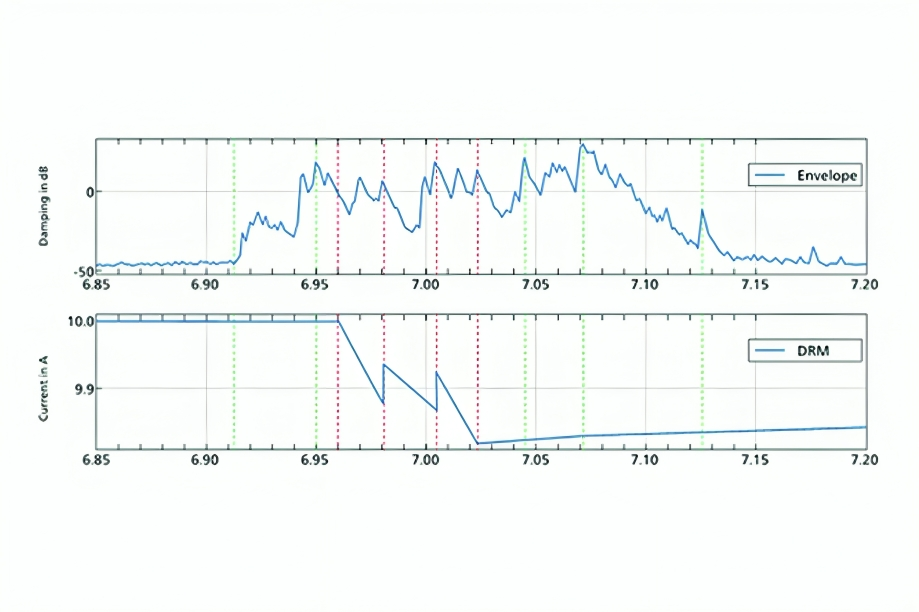
Combining VAM and DRM
The VAM and DRM measurements of OLTC represent mechanical and electrical time sequences respectively, and provide an opportunity for a complimentary evaluation. Using the vibro-acoustic measurement, all OLTC components that produce sufficient vibrations are picked up and can be considered for evaluation. In contrast, a dynamic resistance measurement is only affected by operations that cause a change in the test current. Individual events in the DRM curve can typically be associated with the movement of diverter switch contacts. Thus, this information can map parts of the envelope curve to specific steps in the switching operation, such as opening or closing contacts.
Case Study: Comparison of Sister Units
The VAM results of two 410 kV / 27 kV transformers are discussed in the following example. Both units have MR Oiltap® Type G diverter switch on-load tap changers.
Since fingerprints from the units under test aren’t available, comparing the two sister units is an effective approach for assessing the results. The following evaluation will only focus on the diverter switch operation.
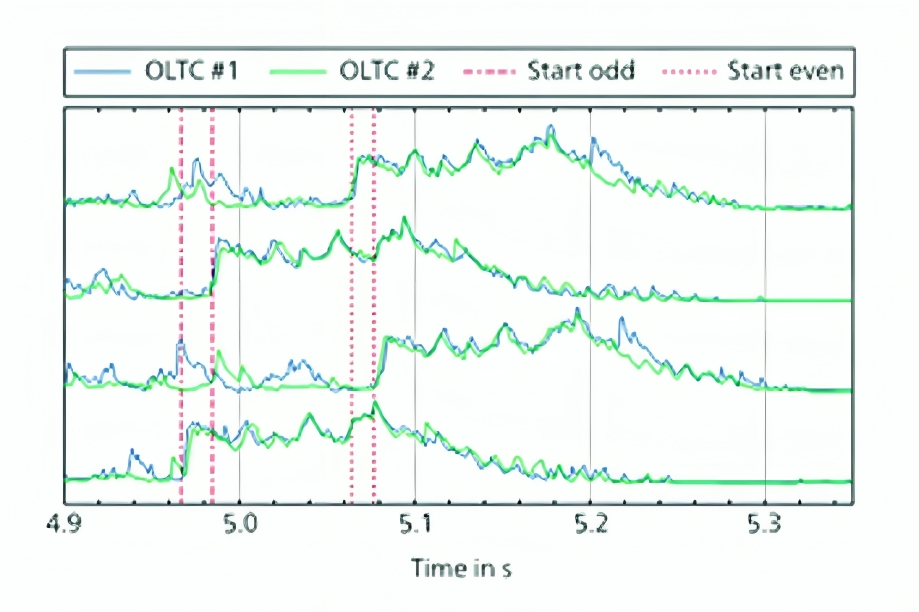
The comparison of the envelope curves reveals that the vibration pattern of the two sister units matches almost perfectly Figure 9.
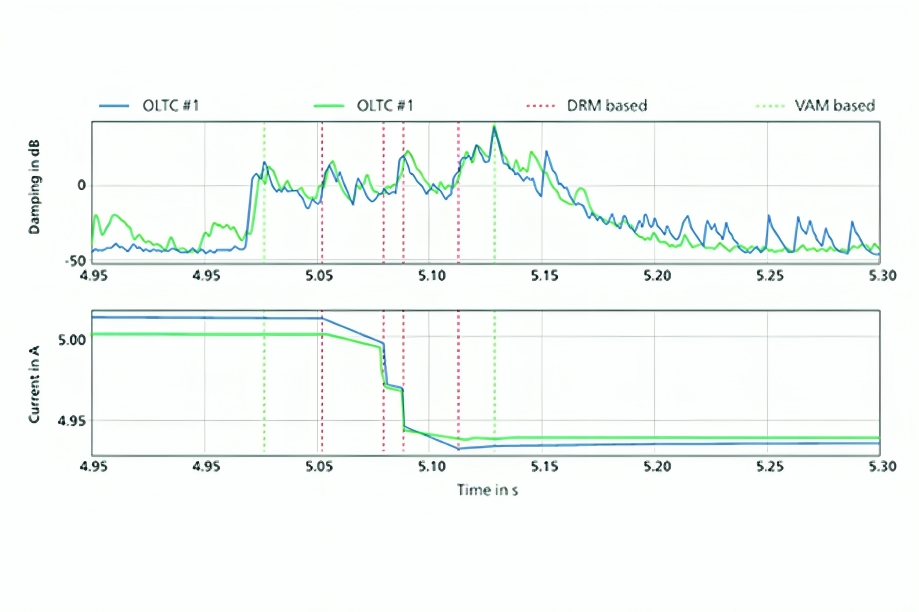
Figure 9 depicts the tap switches from tap one to tap four. The markers indicate the start of the diverter switch operation. Ideally, each tap switch should be compared to its direct counterpart with the same parity and switching direction. Adding in the DRM data (Figure 10) helps map some of the VAM peaks to specific events like the operation of the main and auxiliary contacts.
Combining On-Load Tap Changer, Vibro-Acoustic Fingerprinting and Diagnostics with DRM and VAM optimises equipment monitoring in electrical grids. This innovative approach enhances grid stability and equipment reliability, contributing to the efficiency and resilience of critical infrastructure.
We use cookies to personalize your experience. By continuing to visit this website you agree to our Terms & Conditions, Privacy Policy and Cookie Policy.


-20251010140647.jpg)


-20251007141246.jpg)


-20251010134742.jpg)